Debugging, Timing, and Synthesis
How to Read a Verilog Waveform and Find the First Wrong Cycle
Read expected and actual Verilog waveforms, find the first cycle of divergence, interpret X values, and generate a VCD with Icarus Verilog.
3 min read · Updated
A Verilog waveform plots signal values against simulation time. To debug one efficiently, place expected and actual signals together, align observations with the active clock edge, and stop at the first sampled cycle where they differ. Later mismatches—or a later accidental re-convergence—do not erase the first evidence of incorrect behavior.
A repeatable reading order
| Step | Inspect | Question |
|---|---|---|
| 1 | reset and clock | Did reset reach an active edge, and which edge updates state? |
| 2 | inputs before the edge | Were inputs stable when the design sampled them? |
| 3 | expected vs. actual after the edge | What is the first sampled cycle where they disagree? |
| 4 | decisions at that transition | Which enable, comparison, or state transition changed? |
| 5 | unknown values | Where did the first X originate? |
Worked first-divergence example
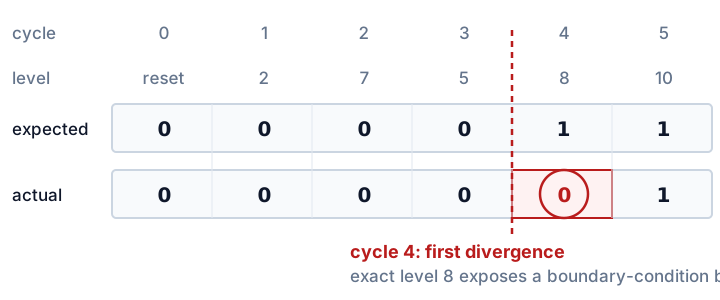
cycle:    0  1  2  3  4  5
level:    -  2  7  5  8 10
expected: 0  0  0  0  1  1
actual:   0  0  0  0  0  1
Cycle 4 is the first and only mismatch. The trace suggests a boundary-condition error: the design handles values below and above 8, but disagrees exactly when level equals 8. That evidence points toward > versus >=; it does not by itself prove which source line contains the defect.
Generate the trace yourself
$dumpfile names a Value Change Dump file, and $dumpvars selects the hierarchy to record. These are simulation/testbench tasks; they do not create synthesized hardware.
The intentionally faulty registered alarm below uses level > 8, while the specification requires the alarm at level >= 8. Inputs change on falling edges and are sampled on rising edges.
`timescale 1ns/1ps

module strict_alarm(
  input wire clk,
  input wire rst,
  input wire [3:0] level,
  output reg alarm
);
  always @(posedge clk) begin
    if (rst) alarm <= 1'b0;
    else     alarm <= (level > 4'd8); // fault: boundary value 8 should assert
  end
endmodule

module tb;
  reg clk, rst;
  reg [3:0] level;
  reg expected;
  wire actual;
  integer cycle, first_cycle;

  strict_alarm dut(clk, rst, level, actual);
  always #5 clk = ~clk;

  task sample;
    input [3:0] next_level;
    begin
      @(negedge clk); level = next_level;
      @(posedge clk); #1;
      cycle = cycle + 1;
      expected = (level >= 4'd8);
      if (first_cycle == 0 && actual !== expected) begin
        first_cycle = cycle;
        $display("FIRST_DIVERGENCE cycle=%0d level=%0d expected=%0d actual=%0d", cycle, level, expected, actual);
      end
    end
  endtask

  initial begin
    clk = 1'b0; rst = 1'b1; level = 4'd0;
    expected = 1'b0; cycle = 0; first_cycle = 0;
    $dumpfile("wave0.vcd");
    $dumpvars(0, tb);

    @(posedge clk); #1;
    if (actual !== 1'b0) begin $display("FAIL RESET"); $finish; end
    @(negedge clk); rst = 1'b0;

    sample(4'd2);
    sample(4'd7);
    sample(4'd5);
    sample(4'd8);
    sample(4'd10);

    if (first_cycle !== 4) begin $display("FAIL DIVERGENCE"); $finish; end
    $display("PASS");
    $finish;
  end
endmodule
Expected diagnostic lines:
VCD info: dumpfile wave0.vcd opened for output.
FIRST_DIVERGENCE cycle=4 level=8 expected=1 actual=0
PASS
Compile and run locally with:
iverilog -g2005 -s tb -o wave0.vvp example.v
vvp wave0.vvp
Then open wave0.vcd in a viewer such as GTKWave. If the expected dump notice or file is absent, verify the $dumpfile/$dumpvars calls, runtime options, working directory, and simulator diagnostics rather than assuming one specific cause.
What the VCD contains
A VCD header maps opaque identifier codes to signal names and declares the timescale. The body records time markers and values that changed. This excerpt comes from the Icarus-generated file for the example above:
$timescale
 1ps
$end
$scope module tb $end
$var wire 1 ! actual $end
$upscope $end
$enddefinitions $end
#0
x!
#5000
0!- The timescale is
1ps, the precision from`timescale 1ns/1ps. A 5 ns clock edge therefore appears at#5000. - In this particular Icarus file,
!identifiesactual. Identifier codes are tool-generated and opaque; always consult the file’s$vardeclarations. Aliased signals may share an identifier. x!at#0saysactualis unknown before the first reset edge updates it.0!at#5000is the first known value.- A signal absent from a later timestamp did not change at that timestamp.
Xmeans the simulator cannot determine 0 or 1;Zmeans high impedance.
An X is evidence, not a diagnosis. Trace it backward to the first unknown driver, then inspect reset, unconnected ports, incomplete procedural assignments, conflicting drivers, and reads before the first write.
The clocked alarm process assigns alarm on every active edge. Its sequential behavior is a flip-flop; there is no latch in this example.
Sources and verification
Example provenance: SkillLift Labs authored this boundary-comparison waveform as a parallel debugging example, not as a course-task answer. tests/scripts/tutorial-verified-examples.test.ts compiles it in Verilog-2005 mode, reproduces the diagnostic output, independently checks the cycle-4 boundary failure, and validates the published VCD excerpt against the generated file. Automation verifies those stated properties; human technical review for indexing remains a separate gate.